Bob talks
Bob Stuart, creator of MQA, talks in detail about this revolutionary British technology that sets a new standard in capturing, delivering and reproducing digital audio.
Appendix 1: A ‘Tarnished Test’ Signal
The files submitted [1] contained computer-generated test signals interleaved with the music. We assume that the music segments were included to ‘trick’ the encoder into treating it as music.
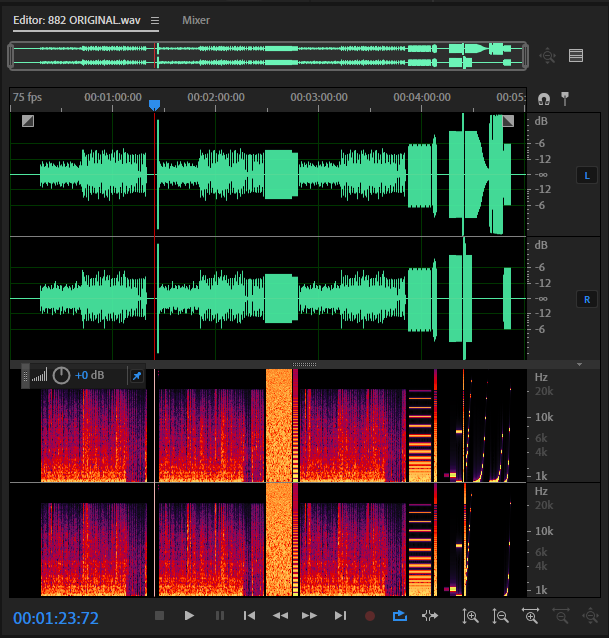
The screen capture below shows (upper in green) the waveform of L & R channels throughout the 88.2kHz input signal. Below that (in red/orange) is their spectral content. The 44.1kHz file was similar. The signal was out of gamut in several places, including ‘overs’ of +0.72dB, and the impulse. The files contained significant ‘washboard’ distortion.[2]
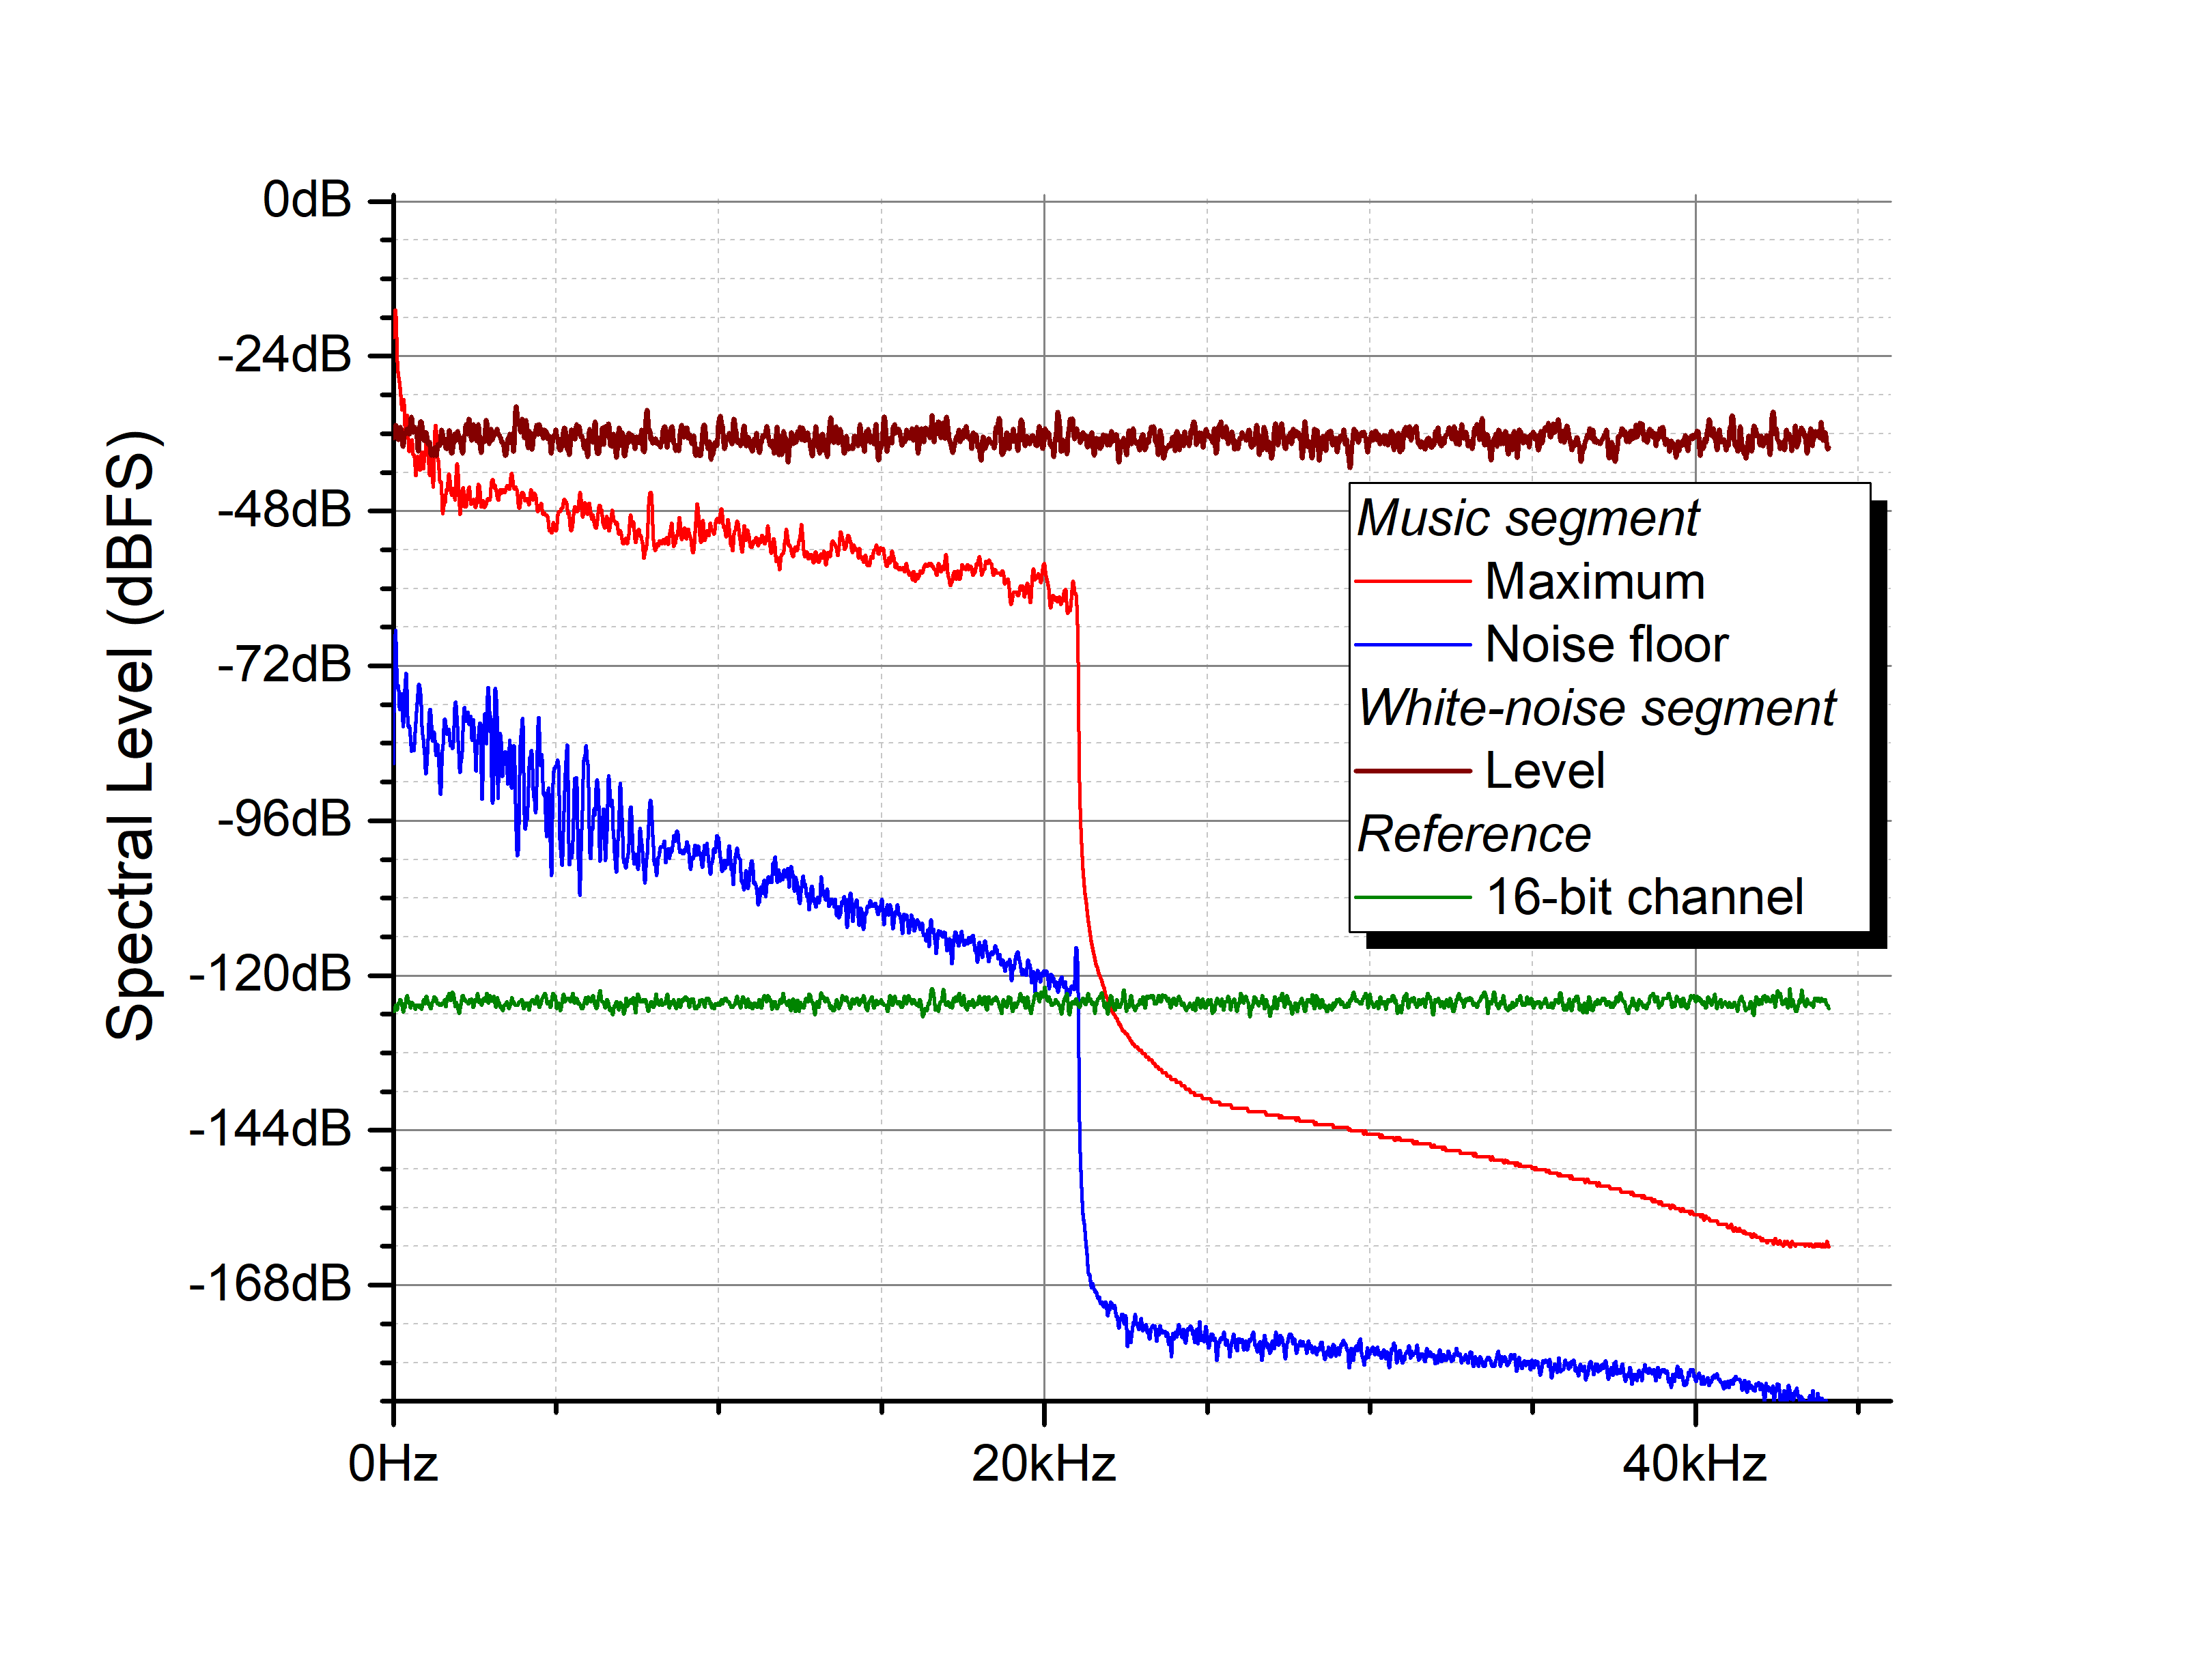
The content of these files does not in any way represent music, as we show in the next Appendix.
Appendix 2: Test Signals and Music
Footnotes
[1] Files from the blogger’s download link.
[2] See Dither paper: Stuart, J. Robert; Craven, Peter G., ‘The Gentle Art of Dithering’, JAES Volume 67 Issue 5 pp. 278-299; May 2019. Open Access http://www.aes.org/e-lib/browse.cfm?elib=20457
[3] Throughout these appendices, we have used FFT analysis with 21.5Hz bin-width as this can give reasonable agreement between noise and tonal signals at low frequencies as this corresponds to the narrowest (equivalent rectangular bandwidth) ERB for human listeners. (For more detail see: J. R. Stuart, “Noise: Methods for Estimating
Detectability and Threshold,” J. Audio Eng. Soc., vol.
42, pp. 124–140 (1994 Mar.). on AES website )
Index
All that glitters is not gold(en)
Appendix 2: Test Signals and Music

